Custom Analytics Widgets
Monitor your campaigns and call logs in a more visualized way with custom charts and filtered metrics.
Analytics Widget Overview
Custom Analytics Widgets provide a powerful way to monitor your campaigns and call logs through visualization. This feature allows you to transform raw data into actionable insights using a variety of interactive chart formats.
Creating and Personalizing Widgets
- 1
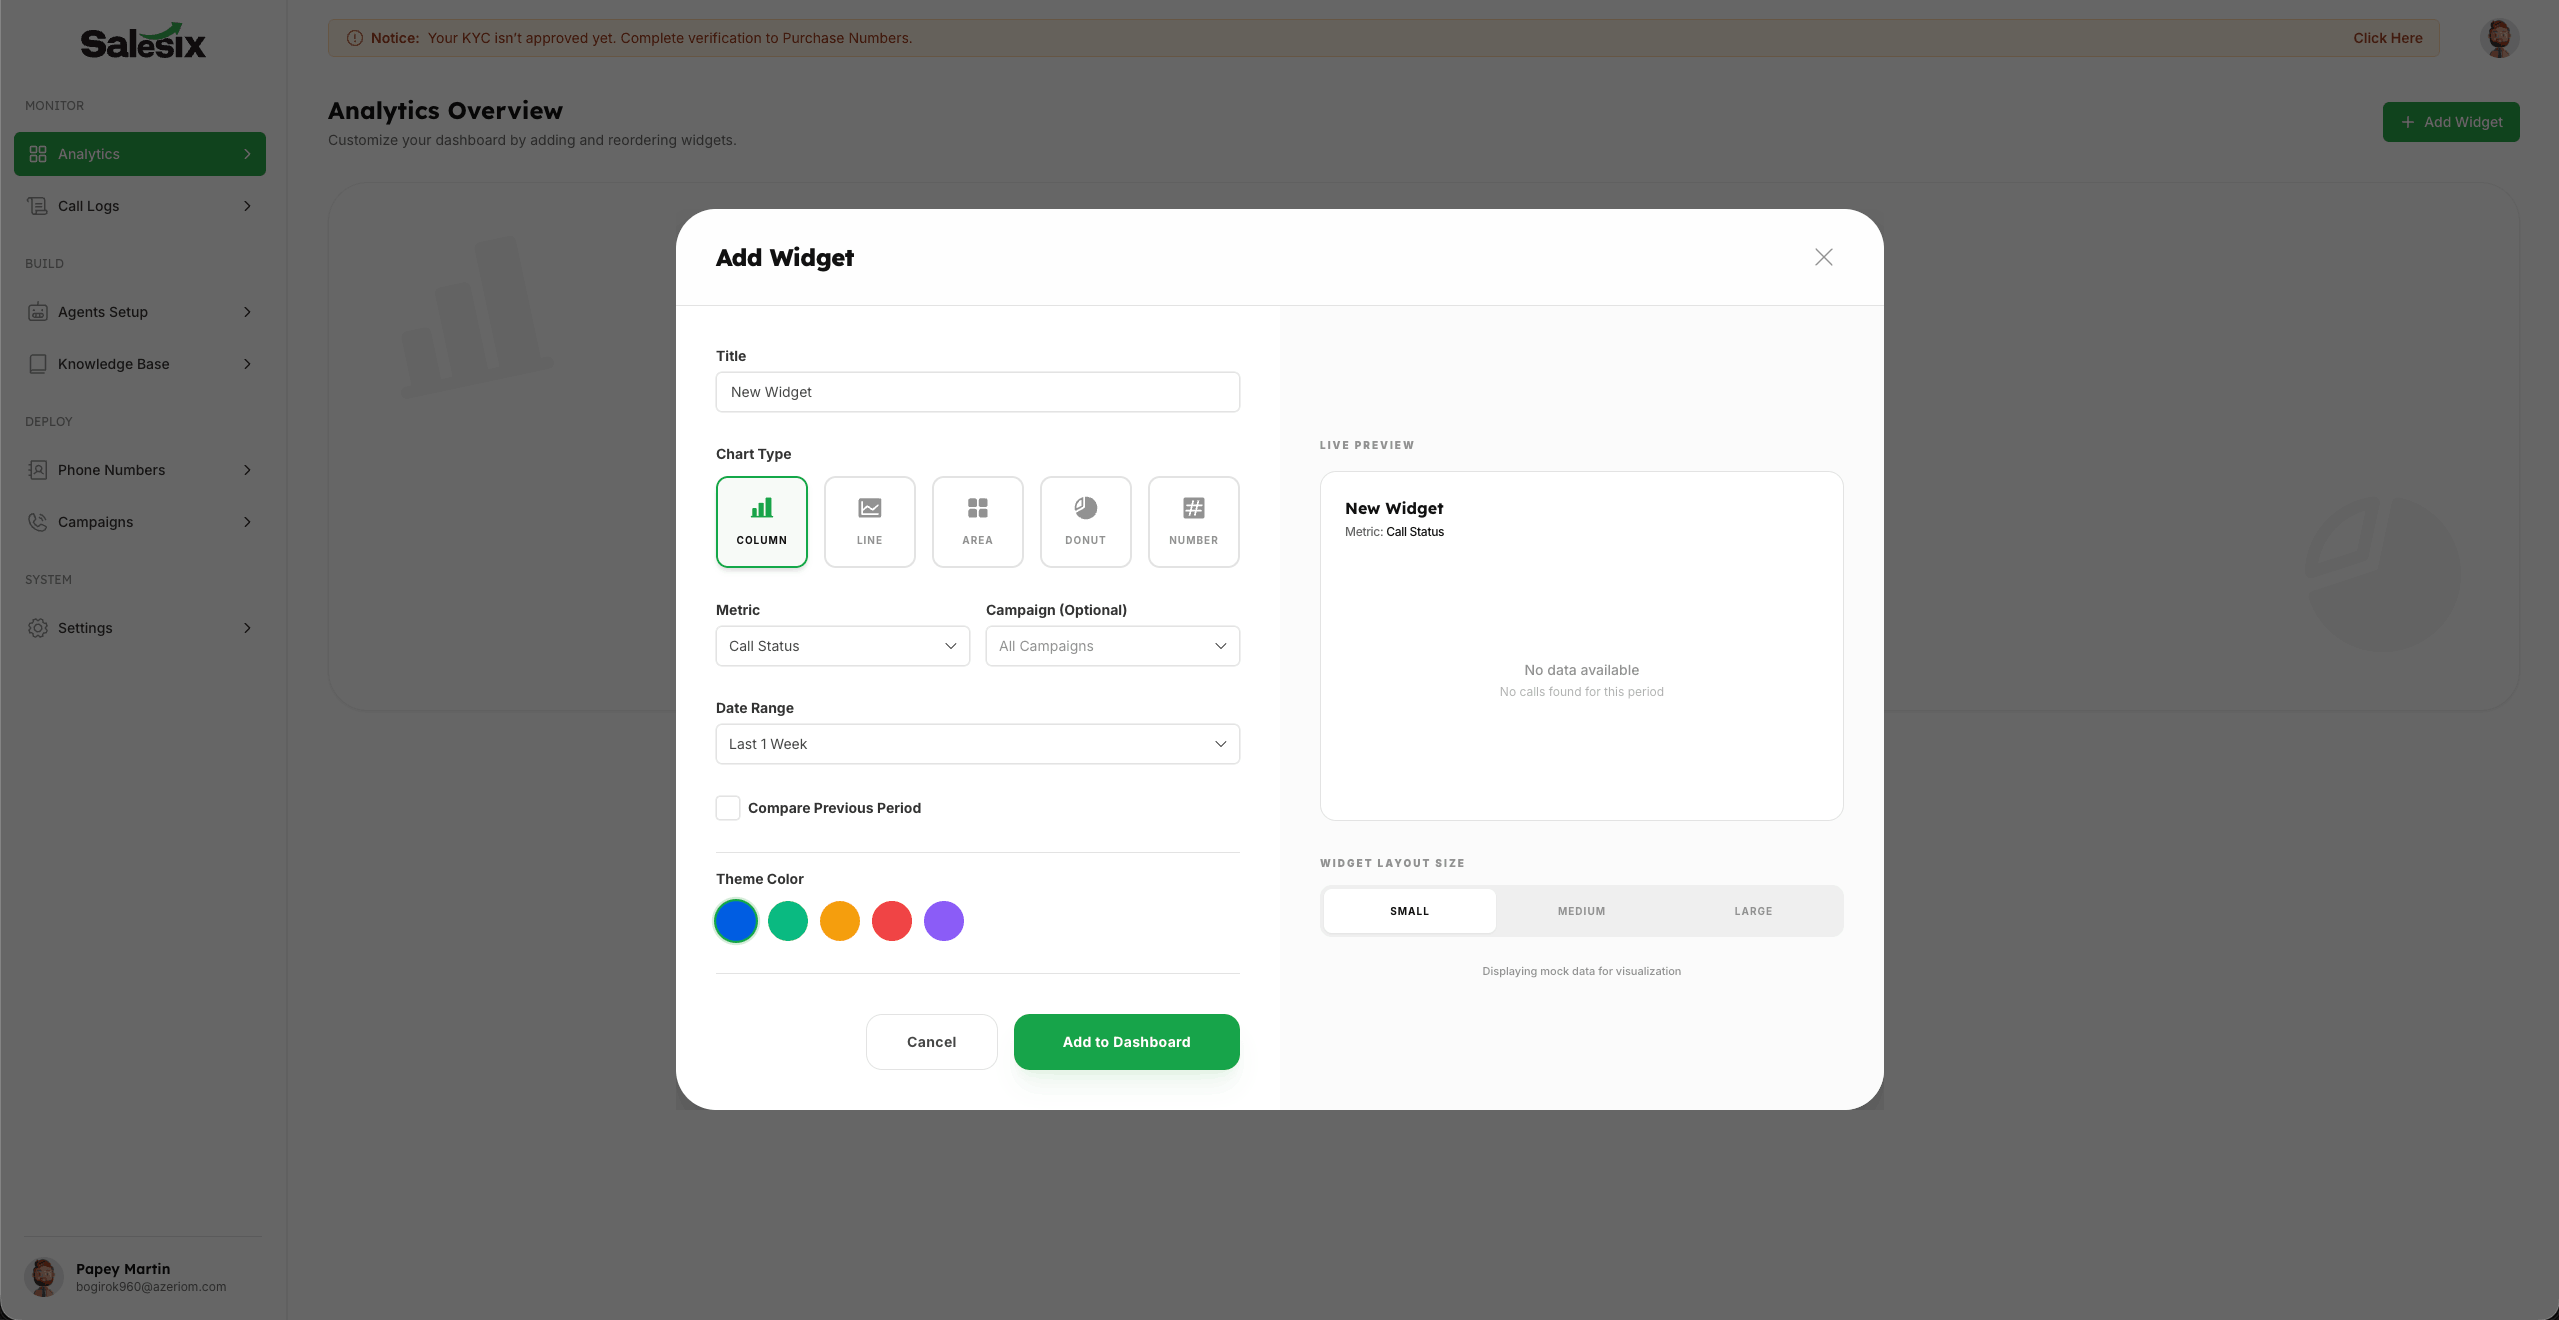
Click on the Add Widget button to open the widget creation popup.
- 2
Choose your preferred visualization from multiple chart types: Column, Line, Area, Donut, or Number Only.
- 3
Select from a wide range of metrics to monitor and track exactly what matters for your business operations.
- 4
Use powerful filters like Campaign and Date Range to drill down into specific data sets.
- 5
Personalize your dashboard experience by adjusting Widget Size and Color schemes for better organization.
- 6
Save your configuration to instantly see the new metrics on your live analytics dashboard.
Summary
Custom analytics widgets empower you to build a highly personalized monitoring suite. By selecting the right chart types and metrics, you gain a clear, visual understanding of your campaign performance and operational efficiency in real-time.